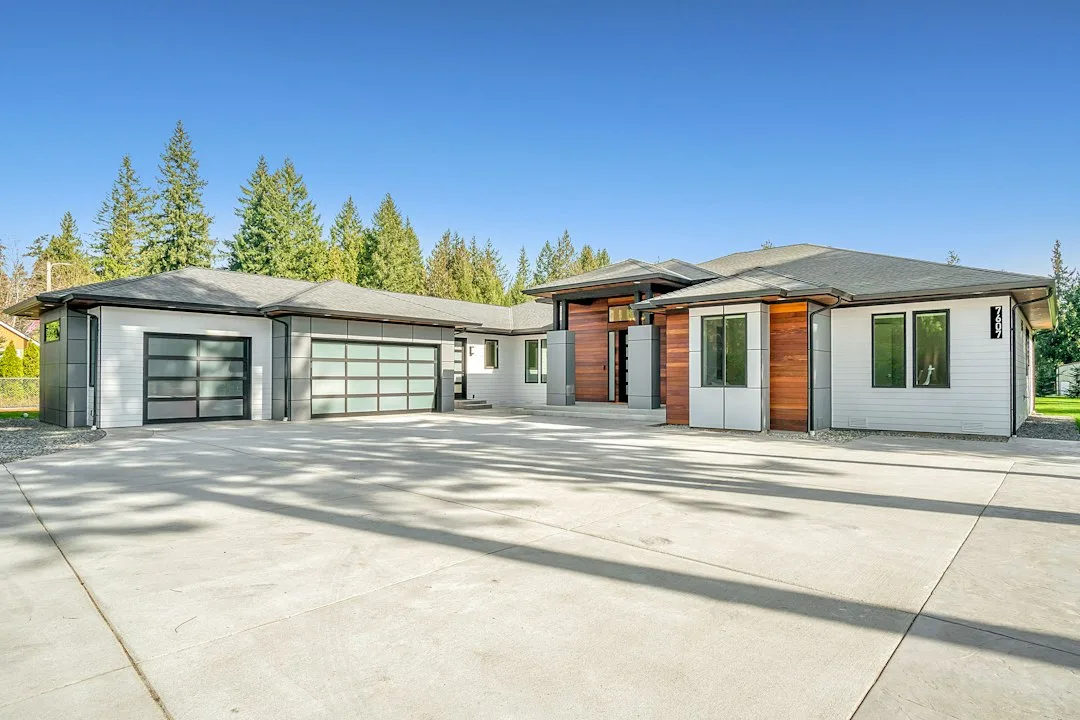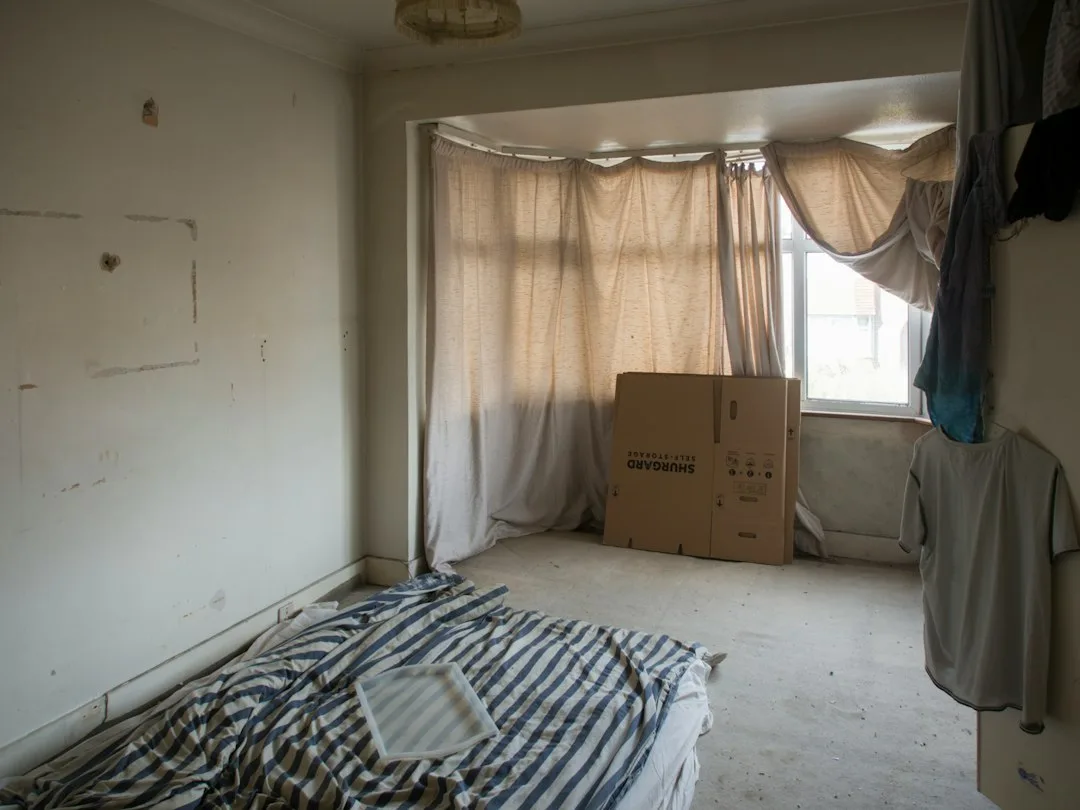
Home flipping has traditionally meant one thing: find undervalued properties in major markets, renovate aggressively, and sell into a competitive buyer pool. That model is fracturing. Secondary market home flipping—purchasing distressed or dated properties in Tier 2 cities like Greenville, South Carolina; Des Moines, Iowa; and Sioux Falls, South Dakota—now generates higher return-on-investment than flipping comparable properties in saturated metro areas like Los Angeles or Boston.
The trend accelerated dramatically between 2025 and 2026 as acquisition costs in primary markets rose 18–22% while renovation budgets stayed flat. Investors who adapted their geographic strategy found that secondary markets offered cheaper purchase prices, lower labor costs, and faster buyer absorption.
Why acquisition costs collapsed in secondary markets
Markets like Fort Wayne, Indiana and Raleigh, North Carolina saw substantial inventory increases starting in early 2026, driven by rate-sensitive sellers exiting the market and builders completing new subdivisions. This inventory surge pressured asking prices downward by 8–14% in select secondary markets.
A single-family home in Charlotte’s outer rings that would cost $280,000 to acquire in early 2025 dropped to $245,000–$255,000 by mid-2026. That $30,000 gap compounds dramatically when you’re financing multiple projects annually.
Meanwhile, labor availability in secondary cities is often higher than in coastal metros, reducing contractor availability premiums. Plumbers and electricians in Omaha, Nebraska typically charge 15–20% less per hour than comparable tradespeople in Denver.
Quick Tips
- Monitor secondary market unemployment rates—lower unemployment often means higher labor costs and longer contractor availability windows.
- Build relationships with local real estate attorneys before acquiring; secondary markets have different lien and title protocols.
- Track new corporate relocations to secondary cities; employer moves predict buyer demand 12–18 months ahead.
- Compare renovation costs across Tier 2 cities; some secondary markets have risen faster than others due to population inflows.
How renovation timelines compress in secondary markets
Permitting delays are a silent killer of flip profitability in major markets. In San Francisco and New York, renovation timelines routinely extend 4–6 weeks beyond estimates due to permit backlogs.
| Market Type | Average Permit Wait | Typical Flip Cycle |
|---|---|---|
| Major Metro | 6–8 weeks | 5–7 months |
| Secondary Tier 2 | 2–3 weeks | 3–4 months |
| Tertiary Market | 1–2 weeks | 2.5–3.5 months |
Secondary markets like Cedar Rapids and Madison process renovation permits in 14–21 days because volume doesn’t overwhelm local building departments. Shorter timelines mean capital tied up in projects cycles back faster, enabling investors to close more deals annually.
That speed advantage compounds. An investor who completes 8 flips annually instead of 5 increases total profit capacity by 60%, even if per-unit margins are 5–10% lower.
The buyer absorption advantage in secondary markets
A critical mistake many flippers make is assuming secondary market buyers are less willing to pay premiums for renovated homes. Reality is opposite. Buyers in secondary markets often have fewer newly constructed options and face lower builder volume, making well-renovated resale homes more competitive on availability and pricing. Essential Tips for Selecting Your Ideal Real Estate Home guides buyer decision-making, but in secondary markets, the pool is narrower and more motivated.
Greenville, South Carolina saw 34% buyer migration from out-of-state between 2024 and 2026, many relocating for corporate jobs or remote-work flexibility. Those transplants often arrive without existing home knowledge and pay median prices efficiently when homes show well.
A flipped 3-bedroom ranch listing in Greenville’s Eastside neighborhood that stays on market 8–12 days represents normal absorption. The same property type in Los Angeles often lingers 3–4 weeks.
The mistake investors make: ignoring school district strength
Secondary market flippers frequently prioritize lowest acquisition cost over strategic location. They buy the cheapest distressed property available without analyzing whether the neighborhood attracts owner-occupants or predominantly draws investors and landlords.
A concrete failure example: an investor acquired a 1,960-sq-ft ranch in a secondary Midwest market for $118,000, invested $52,000 in updates (kitchen, flooring, bathrooms), and expected $200,000 sale price. The property sat 28 days unsold because it fell in the lowest-performing school district in the city.
When relocated corporate families arrive in secondary markets, they research schools before neighborhoods. Investing $10,000 more to acquire property in a top-rated district typically accelerates sale by 10–14 days and commands 6–9% price premiums. A property in a strong district zone sells itself; one in a declining district requires price cuts to move.
Capital deployment and exit strategy complexity
Secondary market flipping requires tighter exit planning than major metros. Buyer pools are smaller, meaning if your projected buyer profile doesn’t materialize, resale becomes harder.
Professional flipping operations increasingly use 5 Reasons to Know a Real Estate Attorney Even When Not Selling Your Home to structure deals in secondary markets, where title protocols and lien laws vary more than in major metros.
Exit timing matters. Secondary markets often see seasonal swings more pronounced than primary metros—spring buyer demand peaks sharply, then summer through fall sees reduced activity. Flipping a property in February means competing against fewer listings but also fewer active buyers. Completing in late April positions inventory for peak May-June absorption.
Holding costs (mortgage interest, property tax, insurance, maintenance) in secondary markets typically run 20–30% lower than major metros, making slightly extended timelines more tolerable. A 5-month flip cycle versus 3.5 months represents only a 1–2% cost difference in secondary markets, whereas the same delay in Boston or Seattle could compress margins by 8–12%.